A random blog post

The seemingly innocuous word ‘random’ is often misused in the English language. This is true of many words but I want to dedicate some time to discuss the word ‘random’ because of its fascinating mathematical meaning and the importance of truly random processes to the world around us.

One of the fantastic comics from XKCD… https://imgs.xkcd.com/comics/im_so_random.png

What does random actually mean in mathematics?

Firstly lets talk about what it doesn’t mean. For most people, being random is akin to being strange, weird or erratic. This has become its common usage, the Oxford English Dictionary has a similar definition: ‘being made, done or happening without method or conscious decision’ (OED 10th Edition). So what’s the problem here? The issue is that the word random has a hidden mathematical meaning, something that most people are completely unaware of, even as the word emanates from their lips.

In mathematics, something that is random has no predictability or correlation. If you have a random sequence of numbers, then picking one number will give you no clue about what number came before it or what number will follow afterwards. It’s a very simple concept on paper but to actually calculate or observe truly random and unpredictable behaviour in the real world is very difficult. The problem is that in the natural world, almost every event that ever happens (for things larger than atoms) has an effect on something else which leads to a constantly growing web of interconnected events. Our reality is in fact a result of an almost infinite combination of interconnected events from the past affecting every aspect of the present. This interconnectivity means that most events that appear random such as the result of a dice throw or the positions of grains of sand on a beach are in fact predictable but only if you know all the smallest details of past events and how they affect each other.

Let’s take a simple coin throw as an example, on the surface the result (heads or tails) appears random and unpredictable).

However, a study by Persi Diaconis found that when a machine flips a coin with identical force and spin, the outcome is highly predicable. Not only that but different coins have different biases to fall on one particular side, and the result of a coin toss is highly dependent on the angle that the initial force is applied to the coin. All these factors are well known to magicians who can toss a coin is a seemingly natural way whilst being able to predict the outcome with amazing certainty.

Computers also suffer from the problem of non-randomness. When you command a computer to generate a sequence of random numbers it actually starts from a seed number (any number can be a seed) and then it runs a complex (but predicable) algorithm to generate seeming uncorrelated, random numbers. Here’s a gif of a program I made to illustrate random number generation…
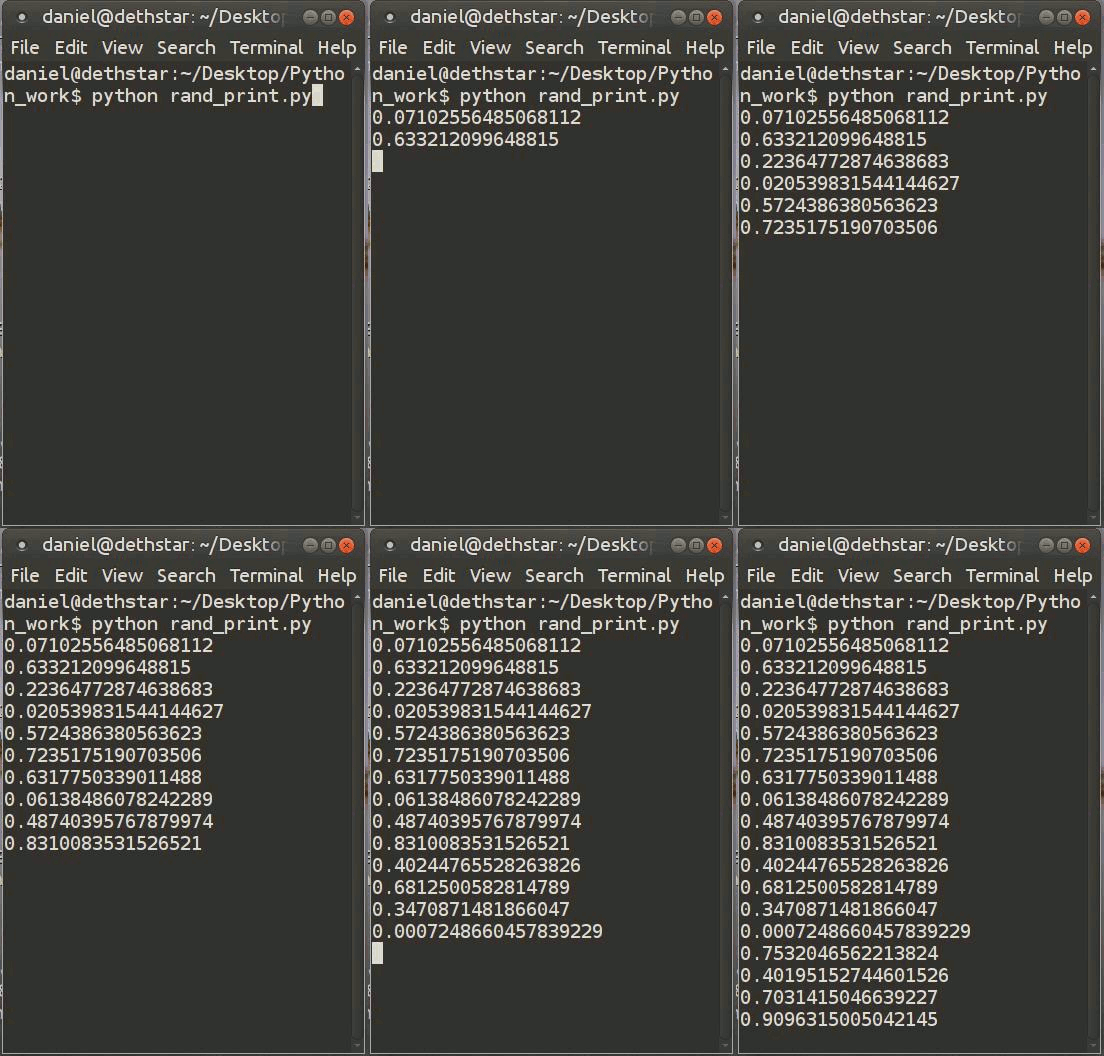
A program that generates psudo-random numbers between 0 and 1.

Because these numbers are generated from a fixed seed in a predictable way, we call these numbers psudo-random. They are not safe to use for encrypting data or securing your computer. To produce better randomness, some computers measure difficult-to-predict things such as the time of your keystrokes, or the electronic noise in a circuit.

My point is that most random events that we experience in everyday life are far from random. By labelling such things as random we are actually obscuring the fact that they only appear random because of our own lack of understanding about all the factors that control them.
So, are there any examples of truly random events? The answer is yes, but for these examples, you need to delve into the quantum world of atoms and electrons. In quantum mechanics, interactions and movements are not governed by basic cause and effect but by probability. For example, electrons do not orbit in circles around atoms, they appear and disappear within a cloud surrounding the atom. If you look close to an atomic nucleus (the dark area in the diagram – right) you may spot electrons appearing and disappearing but, you will never know exactly when or where this is going to happen (this event is random). The further you move from the nucleus the rarer these appearances and disappearances become, still following a random sequence.

When a radioactive element decays, the nuclei of its atoms change or shed mass. When you are observing trillions of atoms you can predict how many will decay per hour, but if you isolate just one atom you will never know exactly when it will decay.
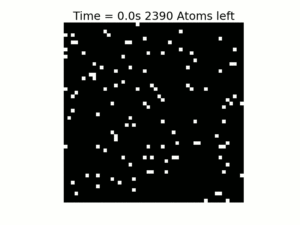
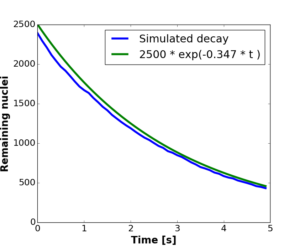
The exact time that a radioactive atom (black pixel on left plot) decays is unknown, but when the number of undecayed atoms (remaining nuclei in right graph) are plotted against time, a clear pattern emerges. Animation and plotting made by author.

For me this final point is the most fascinating. When you look at a single randomly behaving system (like the decay of atoms or the movement of electrons) by themselves they appear completely unpredictable. If you look at a single black pixel (representing an undecayed atom) in the above left plot, there is no way to tell when it will decay and become white. However when you observe large numbers of them the random behaviour ‘smooths’ out to produce a predicable pattern; just look how the decay curve on the right is showing a clear, predictable decrease.

This idea of large-scale patterns emerging out of small scale randomness extends to our entire world. Everything we interact with and experience which can be though of as ultimately predictable is, in fact, composed of tiny particles moving about, interacting and decaying in a completely random and unpredictable way.

Pretty random really…

Post by: Daniel Elijah

Fractals – a bridge between maths, computing and the arts.

A few months ago, I became involved with a group called Moss Code. Their aim is to use computer coding to inspire and engage with people from the strongly Afro-Carribean Manchester suburb, Moss Side. I was made aware that the Afro-Carribean culture actually has a strong heritage using fractal-like sequences in their art and architecture. Please see this TED talk on the subject. My hope is to try and make a simple computer program for people to generate their own unique fractal patterns, with the possibility of printing them onto t-shirts and fabric bags! So in this post I want to share some of the amazing details of fractals and how such complex behaviour arises from surprisingly simple mathematics.

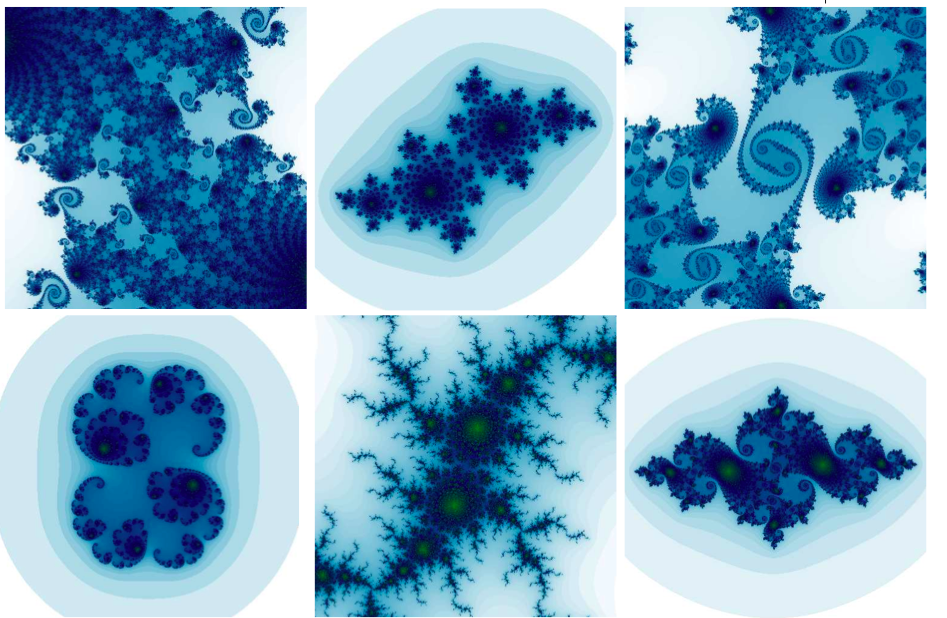
Figure 1. A range of different Julia Set fractals, all share classic fractal properties including self-similarity and symmetry.

Figure 1 shows a range of different Julia Set fractals despite containing very different patterns, they are all generated by the same equation, z = z² + c. So how does such complex behaviour arise from this simple equation? It all hinges on how the variable z grows when you iterate the equation. To clarify, when you iterate an equation you use the answer from the previous calculation as the input to the next.

Lets use a simple example. Say z starts at 0, and c = 1. The value c is a constant and cannot change, only z is able to change. The first iteration gives z = 0² + 1 which is 1. Now z=1, so the next iteration will be z = 1² + 1, which is 2. The next iteration gives 5, then 26, then 677, then 458330, then 210066388901, and so on. You can clearly see that z grows very quickly.

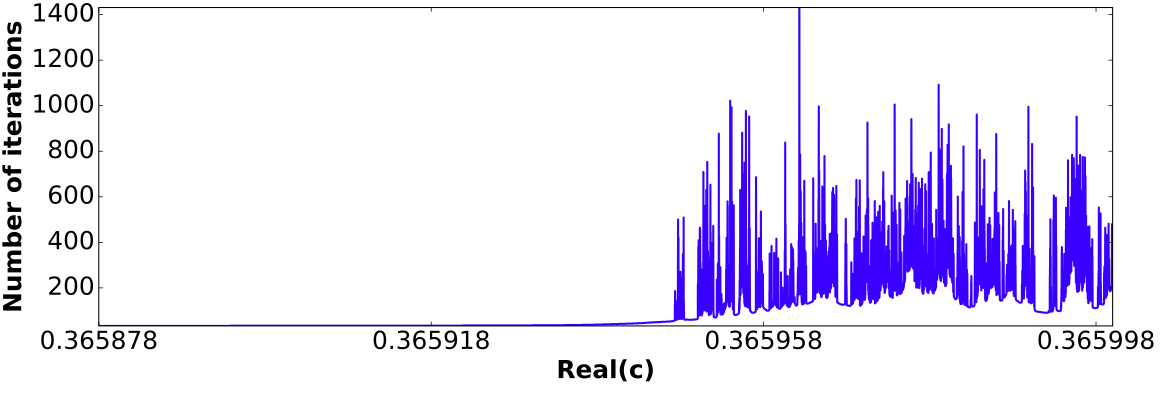
However, for some values of c, the value z stays much the same even after many iterations. You can try to tweak c to find the point between z remaining stable and shooting off towards infinity. If you try this, you’ll find that there is no simple cut-off point but a complex, chaotic region that we recognise is actually the basis of the fractal pattern. In Figure 2, I show this chaotic region by plotting the number of iterations the equation goes through before z reaches a predefined limit.

Figure 2. By changing c in the above equation even by a very small amount, we can see the number of iterations needed to reach a predefined threshold changes, at first steadily, but then chaotically.

It begins changing very slowly and predictably, but at some point it becomes chaotic. Sometimes the equation requires many iterations to reach the limit, while given another very similar value of c, the number of iterations required becomes very low. What is causing this behaviour? The simplest answer is positive feedback, or a runaway effect.

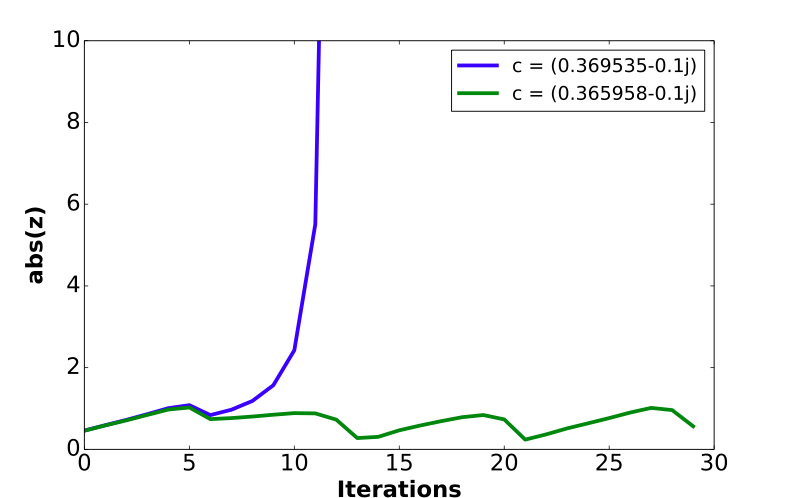
Figure 3. The equation z = z2 + c is iterated 30 times. The changing absolute value1 of z is shown for two similar values of c. Note the drastically different behaviour.

This effect is illustrated in Figure 3. Here the blue line increases sharply upwards while the green line fluctuates only slightly. The differences between the two lines is that the value c is altered by 0.003577. For the blue line this change is enough to make it go through a very rapid self-sustaining increase. While the green line goes up but then decreases again. It is this property of z and c that lies at the heart of creating the beautiful fractals in Figure 1.

Getting complex

The fact that the equation z = z² + c can decrease might be confusing. Surely, as z gets large, squaring it would just make it larger. Even if z is negative then squaring it will just turn it positive. So why doesn’t z get ridiculously large for all values of c? At this point it is important to say that both the values of c and z are not actually normal numbers, they are complex numbers.

Normal numbers are exactly what you would expect…each number is a single value which can be positive, negative or a fraction/decimal or all of these things. Complex numbers are a bit more…well, complex. They contain two components; a real number and an imaginary number. The real number is essentially the same as a normal number but the imaginary number (which is represented using either i or j) can become a negative number when it is squared, a normal number can never do that. It is this imaginary component of c and z that allows the equation z = z² + c to decrease when it is iterated.

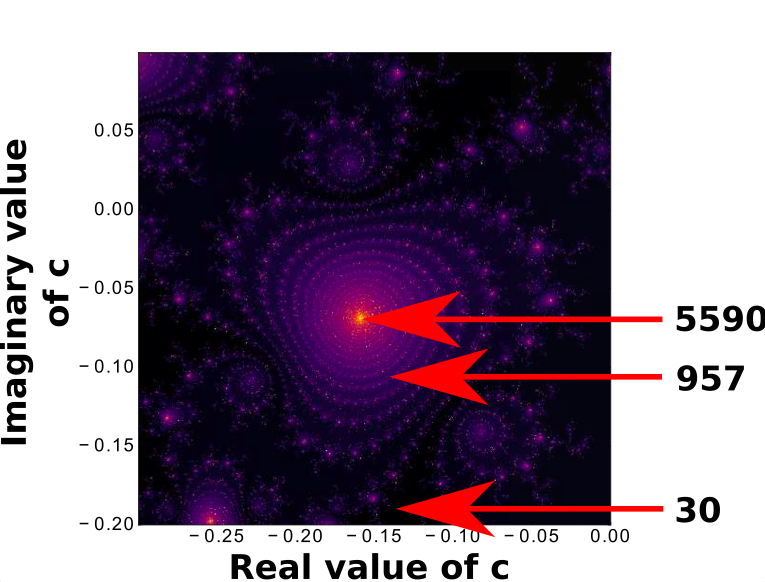
Now we have cleared that up, lets break down what’s going on in a fractal image. The fractals shown in Figure 1 are simply showing the number of iterations needed for z to reach a threshold (in this case, 100). The two axes represent the different values of the real and imaginary components of the complex number c.

Figure 4. A fractal with the number of iterations needed for z to reach 100 labelled to 3 locations.

To get the colour of the image, we simply count the number of iterations needed for z = z² + c to reach 100. In the bottom of Figure 4, only 30 iterations were required, meaning the z increased quickly. Closer to the nucleus of the spiral, z increased more slowly, meaning the number of iterations the rises. If you followed the spiral inwards for ever, you would find that z would never reach the threshold and the number of required iterations would be infinite.

So to summarise, the amazing complexity of fractals is actually based on a simple equation or rule. In this post, I have only covered one type of fractal…the Julia Set. There are of course many others, such as the famous Mandelbrot set, Cantor set, Koch snowflake and many others, each with their own set of rules and equations. In my opinion, fractals are most remarkable because these abstract mathematical patterns are actually seen everywhere in the natural world; from small-scales such as Alveoli in your lungs or crystals of ice on a windscreen, to the large-scales like the outline of a coastline or the structure of galaxys. Fractals really bridge the gap between the simple mathematical world and the real world whilst providing amazing beauty along the way.

Post by: Dan Elijah.

Save

Neural coding 2: Measuring information within the brain

In my previous neuroscience post, I talked about the spike-triggered averaging method scientists use to find what small part of a stimulus a neuron is capturing. This tells us what a neuron is interested in, such as the peak or trough of a sound wave, but it tells us nothing about how much information a neuron is transmitting about a stimulus to other neurons. We know from my last neuroscience post that a neuron will change its spike firing when it senses a stimulus it is tuned to. Unfortunately, neurons are not perfect and they make mistakes, sometimes staying quiet when they should fire or firing when they should be quiet. Therefore, when the neuron fires, listening neurons can not be fully sure a stimulus has actually occurred. These mistakes lead to a loss of information as signals get sent from neuron to neuron, like Chinese whispers.

Figure 1: Chinese whispers is an example of information loss during communication. Source: jasonthomas92.blogspot.com

It is very important for neuroscientists to ascertain information flow within the brain because this is underlines all other computational processes that happen. After all, to process information within the brain you must first correctly transmit it in the first place! To understand and quantify information flow, neuroscientists use a branch of mathematics known as Information Theory. Information theory centers around the idea of a sender and a receiver. In the brain, both the sender and receiver are normally neurons. The sender neuron encodes a message about a stimulus in a sequence of spikes. The receiving neuron/neurons try to decode this spike sequence and ascertain what the stimulus was. Before the receiving neuron gets the signal, it has little idea what the stimulus was. We say this neuron has a high uncertainty about the stimulus. By receiving a signal from the sending neuron, this uncertainty is reduced, the extent of this reduction in uncertainty depends on the amount of information carried in the signal. Just in case that is not clear, lets use an analogy…so imagine you are a lost hiker with a map.

Figure 2: A map from one of my favourite games. Knowing where you are requires information. Source: pac-miam.deviantart.com

You have a map with 8 equally sized sectors and all you know is that you could be in any of them. You then receive a phone call telling you that you are definitely within 2 sectors on the map. This phone call actually contains a measurable amount of information. If we assume the probability of being in any part of the map prior to receiving the phone call is equal then you have a 1/8 chance of being in each part of the map. We need to calculate a measure of uncertainty and for this we use something called Shannon entropy. This measurement is related to the number of different possible areas there are in the map, so a map with 2000 different areas will have greater entropy than a map with 10 sectors. In our example we have an entropy of 3 bits. After receiving the message, the entropy drops to 1 bit because there are now only two map sectors you could be in. So the telephone call caused our uncertainty about our location to drop from 3 bits to 1 bit of entropy. The information within the phone call is equal to this drop in uncertainty which is 3 – 1 = 2 bits of information. Notice how we didn’t need to know anything about the map itself or the exact words in the telephone call, only what the probabilities of your location were before and after the call.

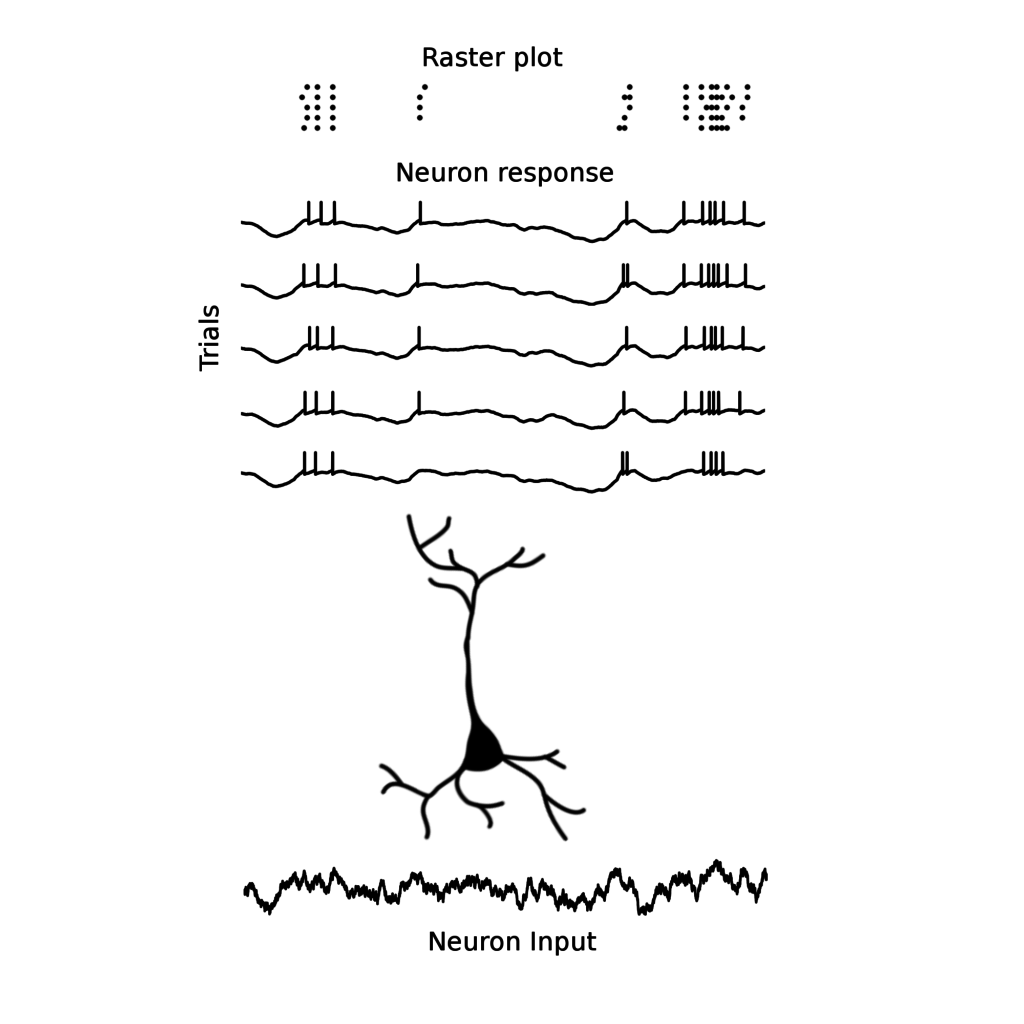
In neurons, we can calculate information without knowing the details of the stimulus a neuron is responding to. The trick is to stimulate a neuron with the same way over many repeated trials using a highly varying, white-noise stimulus (see the bottom trace in Figure 3).

Figure 3: Diagram showing a neuron’s response to 5 repeats of identical neuron input (bottom). The responses are shown as voltage traces (labelled neuron response). The spike times can be represented as points in time in a ‘raster plot’ (top).

So how does information theory apply to this? Well, recall how Shannon entropy is linked with the number of possible areas contained within a map. In a neuron’s response, entropy is related to the number of different spike sequences a neuron can produce. A neuron producing many different spike sequences has a greater entropy.

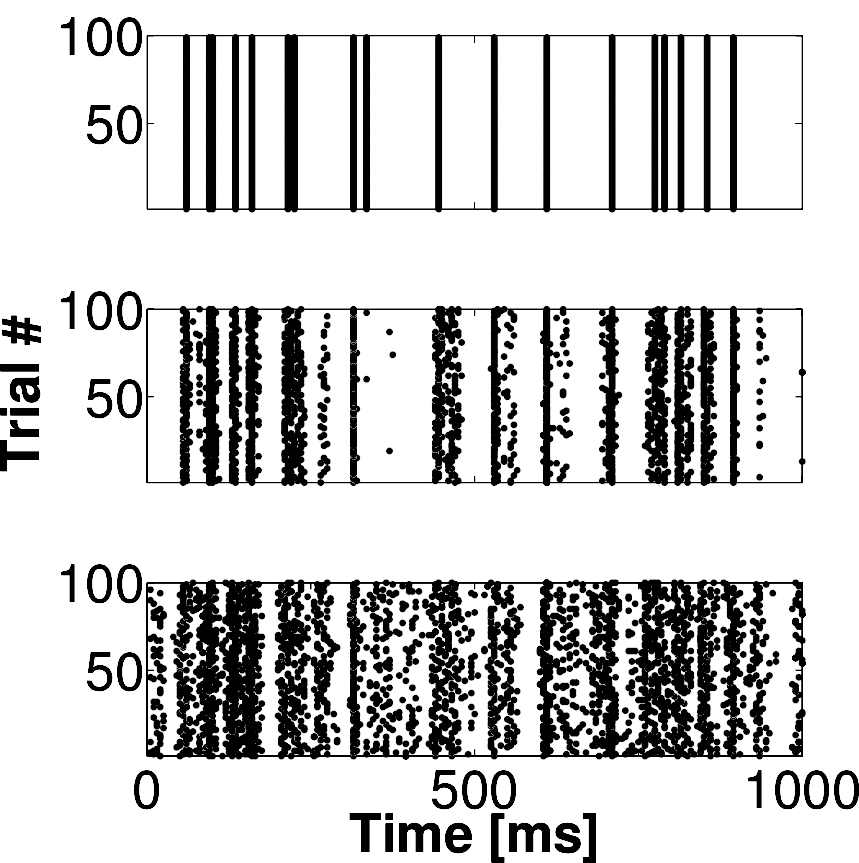
In the raster plots below (Figure 4) are the responses of three simulated neurons using computer models that closely approximate real neuron behaviour. They are responding to a noisy stimulus (not shown) similar to the one shown at the bottom of Figure 3. Each dot is a spike fired at a certain time on a particular trial.

Figure 4: Raster plots show three neuron responses transmitting different amounts of information. The first (top) transmits about 9 bits per second of response, the second (middle) transmits 2 bits/s and the third (bottom) transmits 0.7 bits/s.

In all responses, the neuron is generating different spike sequences, some spikes are packed close together in time, while at other times, these spikes are spaced apart. This variation gives rise to entropy.

In the response of the first neuron (top) the spike sequences change in time but do not change at all across trials. This is an unrealistically perfect neuron. All the variable spike sequences follow the stimulus with 100% accuracy. When the stimulus repeats in the next trial the neuron simple fires the same spikes as before, producing vertical lines in the raster plot. Therefore, all that entropy in the neuron’s response is because of the stimulus and is therefore transmitting information. This neuron is highly informative; despite firing relatively few spikes it transmits about 9 bits/second…pretty good for a single neuron.

The second neuron (Figure 4, middle) also shows varying spike sequences across time, but now these sequences vary slightly across trials. We can think of this response as having two types of entropy, a total entropy which measures the total amount of variation a neuron can produce in its response, and a noise entropy. This second entropy is caused by the neuron changing its response to unrelated influences, such as other neuron inputs, electrical/chemical interferences and random fluctuations in signaling mechanisms within the neuron. The noise entropy causes the variability across trials in the raster plot and reduces the information transmitted by the neuron. To be more precise, the information carried in this neuron’s response it whatever remains from the total entropy when the noise entropy is subtracted from it…about 2 bits/s in this case.

In the final response (bottom), the spikes from the neuron only weakly follow the stimulus and are highly variable across trials. Interestingly it shows the most complex spike sequences of spikes of all three examples. It therefore has a very large total entropy, which means it has the capacity to transmit a great deal of information. Unfortunately, much of this entropy is wasted because the neurons spends most its time varying its spike patterns randomly instead of with the stimulus. This makes its noise entropy very high and the useful information low, it transmits a measly 0.7 bits/s.

So, what should you take away from this post. Firstly that neuroscientists can accurately measure the amount of information can transmit. Second, that neurons are not perfect and cannot respond the same way even to repeated identical stimuli. This leads to the final point that this noise within neurons limits the amount of information they can communicate to each other.

Of course, I have only shown a simple view of things in this post. In reality, neurons work together to communicate information and overcome the noise they contain. Perhaps in the future, I will elaborate on this further…

Post by: Dan Elijah.

The moons of Jupiter and the speed of light

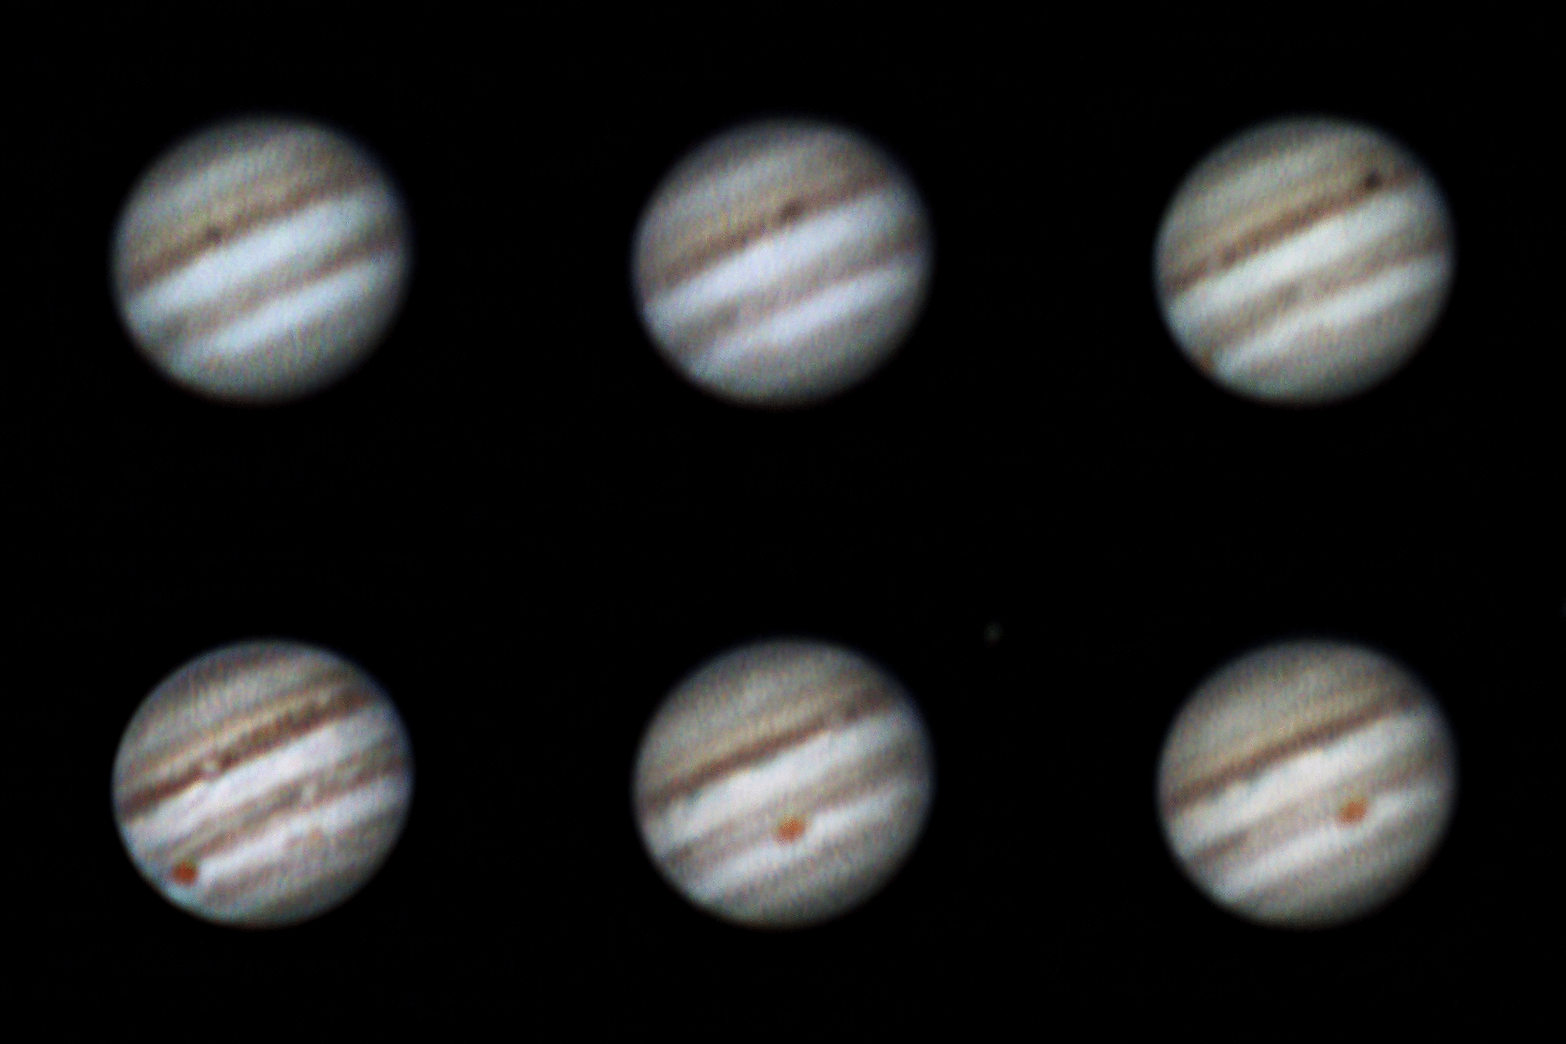
Recently, I was setting up my telescope to image the great planet Jupiter. I was interested in capturing an eclipse of one its largest moons, Io. Everything was ready, all the batteries were charged, the telescope was aligned and tracking the planet, but there was a problem. The eclipse just wasn’t happening. My computer programme predicted it to start at 21:10 on the 12th March 2017, but nothing happened. I was more than surprised, my computer is normally accurate to the second. So I checked the settings, the time is internet controlled so no problem there, the computer showed other stars in their correct positions so I knew it was not having problems with other parts of the sky. Then at about 21:48, Io started to cast a dark circle on Jupiter. I was amazed, I have never seen a total eclipse on Earth but I can now see one on Jupiter. But why was it more than 30 minutes late? It turns out that my confusion was shared by astronomers in the 17th century and, in an effort to explain the discrepancies of Io’s eclipse times, they inadvertently measured the speed of light.

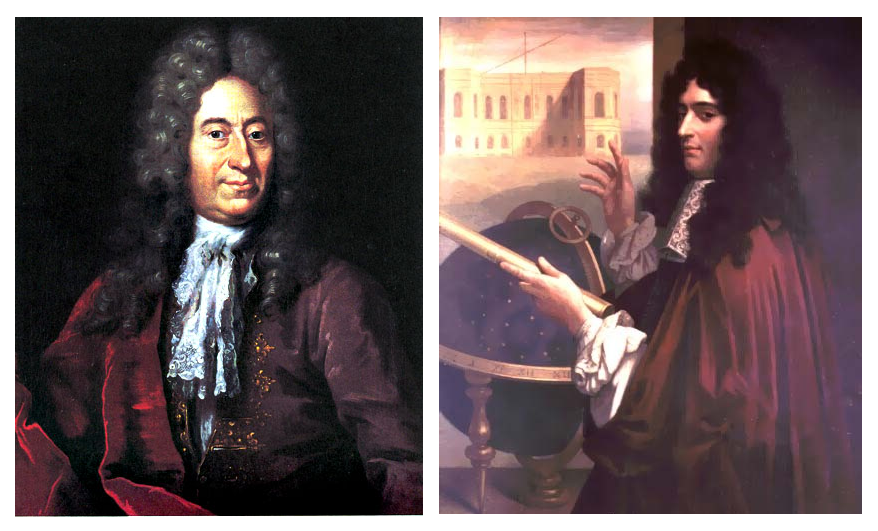
It was the 17th century astronomers Giovanni Domenico Cassini, Ole Rømer and Jean Picard (not from Star Trek) who first studied the eclipses of Io on Jupiter whilst trying to solve the famous longitude problem: before the invention of accurate clocks, there was little way of knowing how far east or west you were sailing from a given location (normally Paris or London). Galileo himself proposed to use the predicable orbits of Jupiter’s moons to calculate the time on Earth, which can then be used to calculate longitude.

Ole Rømer (left) and Giovanni Cassini (right). Along with Jean Picard these pioneering 17th century astronomers observed and studied hundreds of Jovian eclipses. (Wikipedia Commons)

Unsurprisingly, this proved too difficult a task to do on a moving ship with the primitive optical equipment available at the time. On land, however, this method could be used to improve maps and navigation. So Cassini and Rømer set to work. They observed hundreds of Jovian eclipses over several months and were able to determine the difference in longitude between Paris and their location. Unfortunately, there was a problem; after accurately calculating the orbit of Io, Cassini found that sometimes during the year, eclipses were occurring earlier while at other times eclipses  happened later than predicted. Cassini logically surmised that light had to travel at a finite speed instead of instantaneously spanning the distance from Jupiter to Earth. For instance, when the Earth and Jupiter are on near opposite sides of the Sun, the light traveling from Jupiter will take longer to reach Earth (around 54 minutes). This causes the Io eclipses to appear delayed. When the Earth is between the Sun and Jupiter (a period called Opposition), then light from Jupiter takes only about 37 minutes to reach Earth making eclipses of Io happen earlier than expected.

An eclipse of Io imaged by my myself on 12-13/03/2017. The Io eclipse cases a dark spot on Jupiters northern cloud band. The delay of this event caused by the speed of light prompted me to write this post! (My own work)

Strangely, Cassini never followed up his discovery, Rømer continued observing and recording Io eclipses and defined an equation that related the delay caused by the speed of light to the angle between Earth and Jupiter. However, it would not have been possible to publish an actual speed of light because the distances between the planets were not known then. Interestingly, Rømer could have shown the speed of light as a ratio of Earth’s orbital speed…but for some reason he didn’t. It was another famous astronomer, Christian Huygens, who took that credit. He used Rømer’s detailed observations and formula to define the speed of light as 7600 times faster than Earth’s orbital speed.  This equates to a speed of 226328 km/s which is only 25% lower than the true value of light speed.

Christian Huygens, a leader in 17th century science. He was the first person to define the speed of light using the eclipses of Io. (Wikipedia commons)

This was the first time a universal constant had been calculated quantitatively and since then the speed of light has played a huge role in James Clerk Maxwell’s theory of electromagnetism and Einstein’s theories of relativity. But for anyone peering into the night sky, the work of these great men more than 300 years ago shows us that starlight is old…and by looking at it we are looking back in time. We see Jupiter as it was 40-50 minutes ago, the nearest star 4 years ago and the relatively nearby Andromeda galaxy 2.56 million years ago. Not bad for 17th century science.

I think next time I’m sitting by my telescope waiting for an Io eclipse, I’ll be a bit more appreciative of the significance that 30 minute delay had on our understanding of the universe.

Post by: Dan Elijah.

Save

Neural coding 1: How to understand what a neuron is saying.

In this post I am diverting from my usual astrophotography theme and entering the world of computational neuroscience, a subject I studied for almost ten years. Computational neuroscience is a relatively new interdisciplinary branch of neuroscience that studies how areas of the brain and nervous system process and transmit information. An important and still unsolved question in computational neuroscience is how do neurons transmit information between themselves. This is known as the problem of neural coding and by solving this problem, we could potentially understand how all our cognitive functions are underpinned by neurons communicating with each other. So for the rest of this post I will attempt to discuss how we can read the neural code and why the code is so difficult to crack.

Since the twenties we have known that excited neurons communicate through electrical pulses called action potentials or spikes (see Figure 1). These spikes can quickly travel down the long axons of neurons to distant destinations before crossing a synapse and activating another neuron (form more information on neurons and synapses see here).

Figure 1. Neural action potentials. An action potential diagram is shown on the left as if recorded from inside a neuron (see inset). For an action potential arise and propagate through a neuron, it must reach a certain threshold (red dashed line). If it doesn’t the neuron will remain at rest. The right panel shows a real neurons firing spikes in the cortex of a mouse. Taken from Gentet LJ et al. (2010).

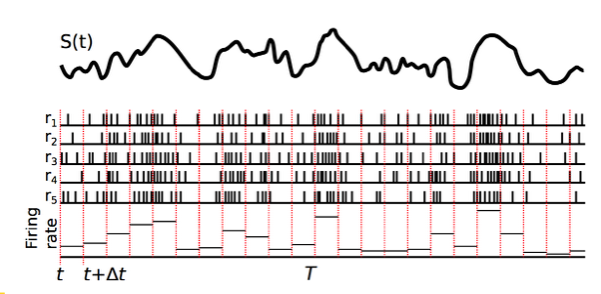
You would be forgiven for thinking that the neural coding problem is solved: neurons fire a spike when the see a stimulus they like and communicate this fact to other nearby neurons, while at other times they stay silent. Unfortunately, the situation is a bit more complex. Spikes are the basic symbol used by neurons to communicate, much like letters are the basic symbols of a written language. But letters only become meaningful when many are used together. This analogy is also true for neurons. When a neuron becomes excited it produces a sequence of spikes that, in theory, represent the stimuli the neuron is responding to. So if you can correctly interpret the meaning of spike sequences you could understand what a neuron is saying. In Figure 2, I show a hypothetical example of a neuron responding to a stimulus.

Figure 2. A stimulus (top trace) fluctuates over time (s(t)) and spikes from a hypothetical neuron are recorded. The stimulus is repeated 5 times producing 5 responses r1,2,3…5 shown below the stimulus. Each response is composed of spikes (vertical lines) and periods of silence. By counting the number of spikes within small time window lasting Δt seconds, we can calculate the firing rate of the neuron (bottom trace).

In this example a neuron is receiving an constantly fluctuating input. This is a bit like the signal you would expect to see from a neuron receiving a constant stream of inputs from thousands of other neurons. In response to this stimulus the receiving neuron constantly changes its spike firing rate. If we read this rate we can get a rough idea of what this neuron is excited by. In this case, the neuron fires faster when the stimulus is high and is almost silent when the stimulus is low. There is a mathematical method that can extract the stimulus that produces spikes, known as reverse correlation (Figure 3).

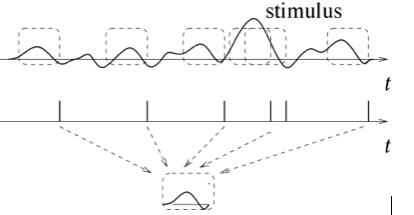
Figure 3. Reverse correlation can identify what feature of the stimulus (top) makes a neuron fire a spike (bottom). Stimulus samples are taken before each spike (vertical lines) and then averaged to produce a single stimulus trace representing the average stimulus that precedes a spike.

The method is actually very simple; each time a spike occurs we take a sample of the stimulus just before the spike. Hopefully many spikes are fired and we end up with many stimulus samples, in Figure 3 the samples are shown as dashed boxes over the stimulus. We then take these stimulus samples and average them together. If these spikes are being fired in response to a common feature in the stimulus we will be able to see this. This is therefore simple method of finding what a neuron actually responds to when it fires a spike. However, there are limitations to this procedure. For instance, if a neuron responds to multiple features within a stimulus then these will be averaged together leading to a misleading result. Also, this method assumes that the stimulus contains a wide selection of different stimulus fluctuations. If it doesn’t then you can never really know what a neuron is really responding to because you may not have stimulated it with anything it likes!

In my next two posts, I will discuss how more advanced methods from the realms of artificial intelligence and probability theory have helped neuroscientists more accurately extract the meaning of neural activity.

Post by: Daniel Elijah
Video astronomy: an update

Early last year I posted an article discussing the merits of webcam imaging. I had just bought some new equipment and wanted to put my enthusiasm into blog form. I was getting fed up with the annoying short observing time our cloudy nights provide us in the UK. Traditional long exposure photography, used to capture faint galaxies and nebulae, is simply out of the question on all but the clearest of nights. However, webcam astronomy is easy to learn, cheap and quick enough to do between clouds. Not only this but, on Moonlit nights when long exposure photography would produce washed out pictures of galaxies, webcam imaging can deliver great Lunar landscapes. Also, during the day, a webcam coupled with a telescope can capture the ever-changing surface of the Sun, meaning you can do astronomy without losing sleep!

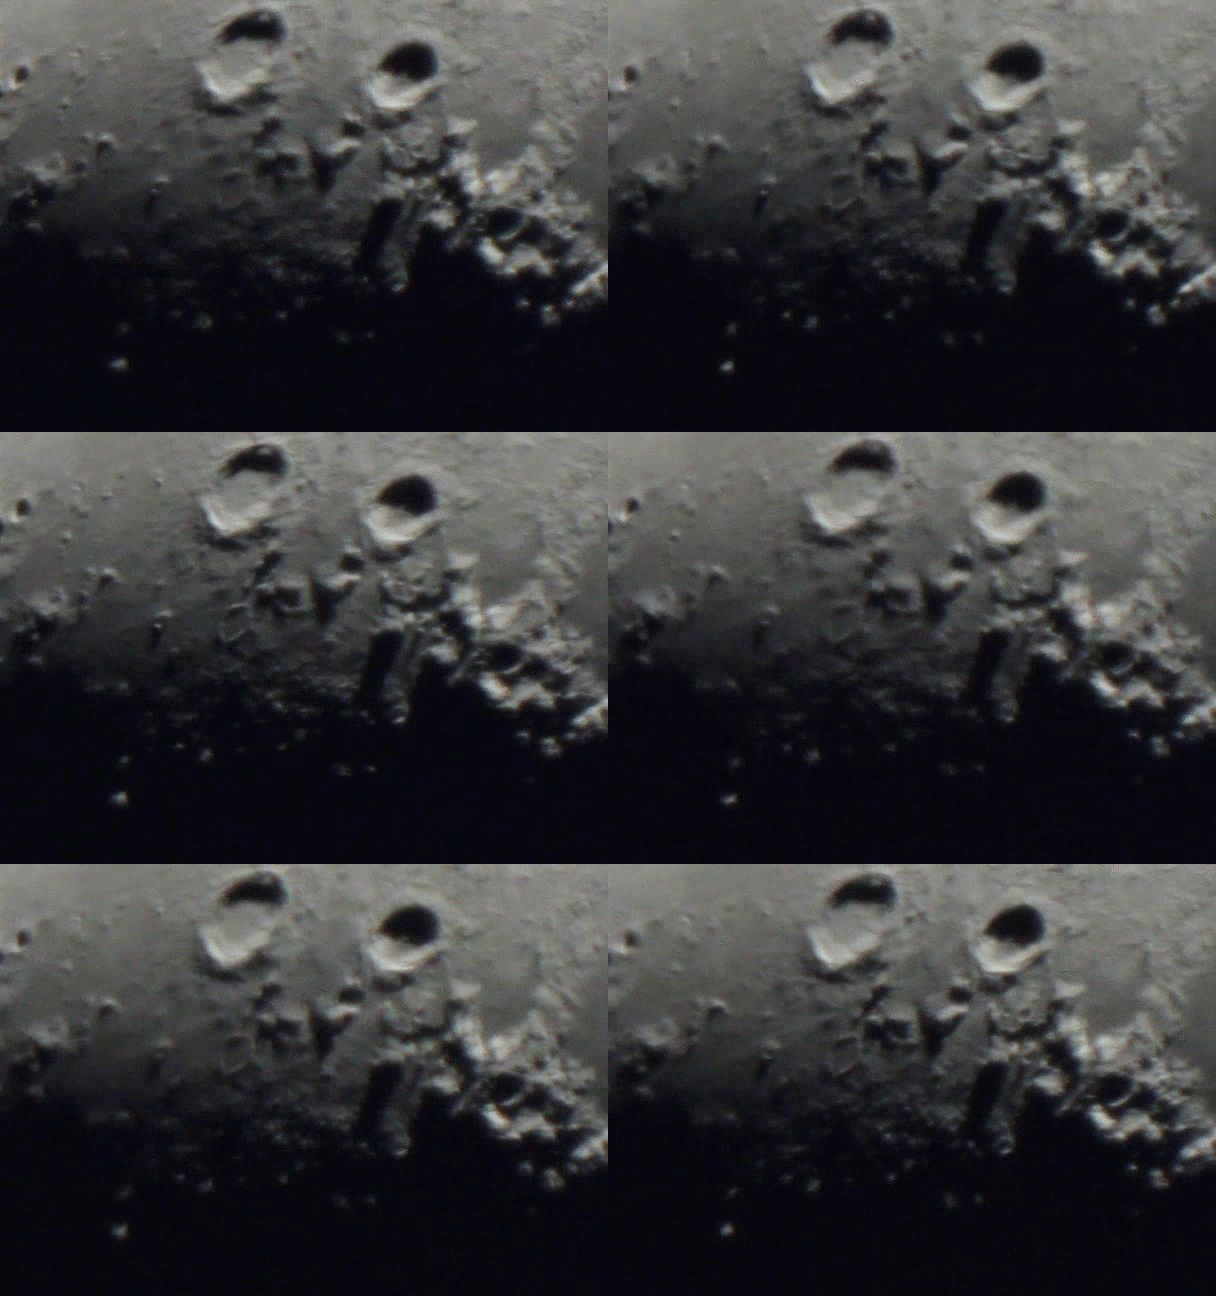
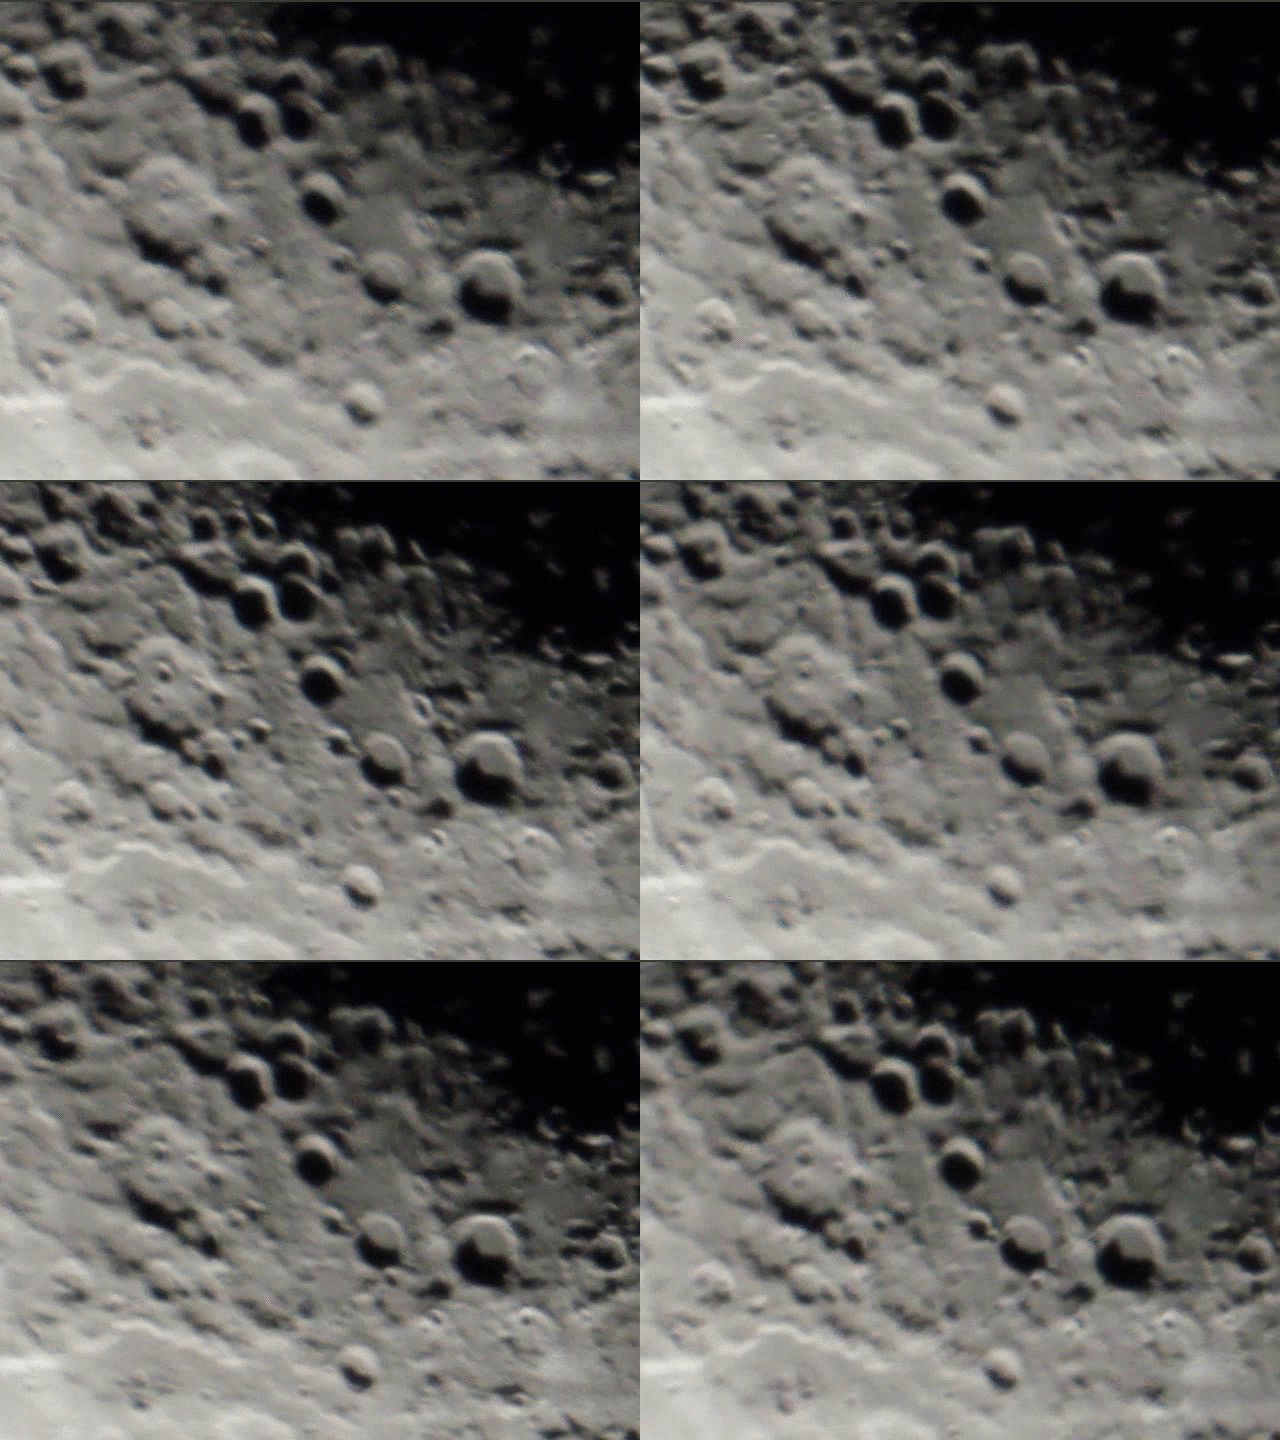
So it is now time to show you some of my attempts at webcam astronomy. Before I show any processed images I first want to demonstrate the main limitation facing astrophotography (other than light pollution); atmospheric turbulence. In image 1, a section of the Moon is being videoed; notice how the detail is constantly shifting in and out of focus. This distortion is caused by currents of air at different temperatures which bend and scatter the light passing through the atmosphere.

Image 1. A movie clip of craters Aristoteles (top left) and Eudoxus (top right). The image shimmers because of the constant turbulence in Earth’s atmosphere. Author’s own work.

Although this may look bad, atmospheric distortion can get far worse! For instance, if the Moon moves close to the horizon then light coming from its surface has to travel through far more air, which badly distorts and scatters this light. Just look at how distorted the Sun looks as it is setting. Atmospheric distortion can also be caused in other ways. In image 2, the Moon was passing just above my house, which unfortunately is not well insulated. This atmospheric distortion caused by hot air escaping from my house dramatically reduces the detail you can see – I’d ask my wife to keep the heating off while I’m imaging but I fear this wouldn’t go down too well.

Image 2. Another movie clip taken when the Moon was setting just above my house. The hot air causes increased turbulence that causes the detail of the lunar landscape to dance and blur. Author’s own work.

Luckily webcam astronomy possesses one amazing advantage over other forms of photography. Unlike traditional long exposure astrophotography, video recordings produces thousands of individual images (or frames) of your target, this means you can be very strict about which frames to keep and which to discard. For example, to get one high quality image, I take about 4 minutes of video containing 14400 frames at 60 frames/sec. I then pick the best 2000 of these frames and, using a program called Pipp, I can stack them together to reduce noise and improve detail (see previous post about stacking). This procedure means I can remove all the frames that were distorted by the atmosphere.

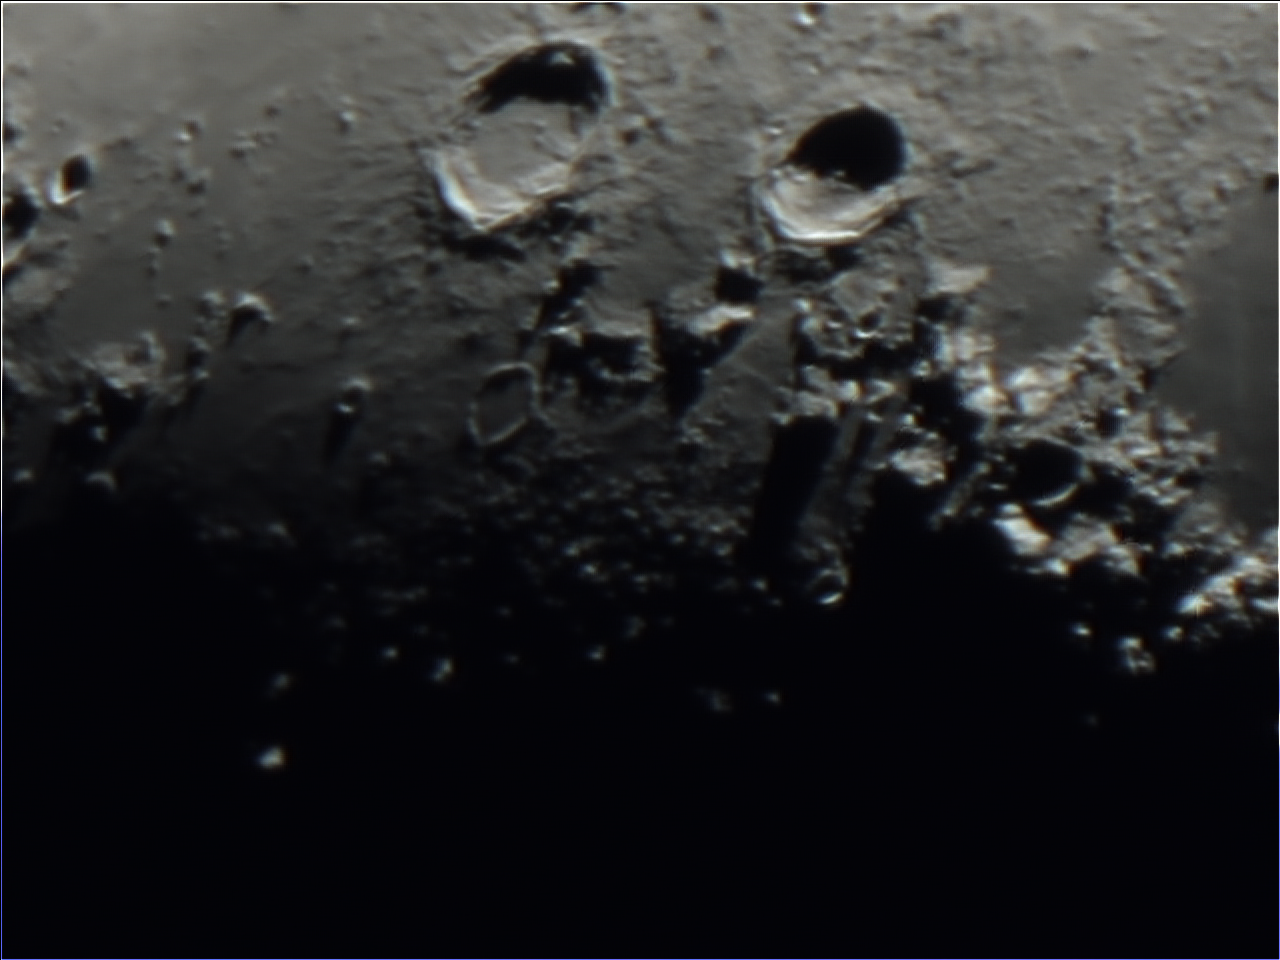
So after all that processing what am I left with? The answer is superior detail, better than any individual frame in the movie or even images taken using long exposure photography. In Image 3, Lunar detail as small as 1Km across can be seen, since the Moon was 370000Km away at that point, this resolution is equivalent to spotting a 2cm wide 1p coin from 7.4Km away! Quite an achievement for my small telescope. All because I have used only the frames taken during atmospheric stillness.

Image 3. A stacked image taken using the best 2000 frames of the movie (Figure 1). The resolution has now improved substantially. Author’s own work.

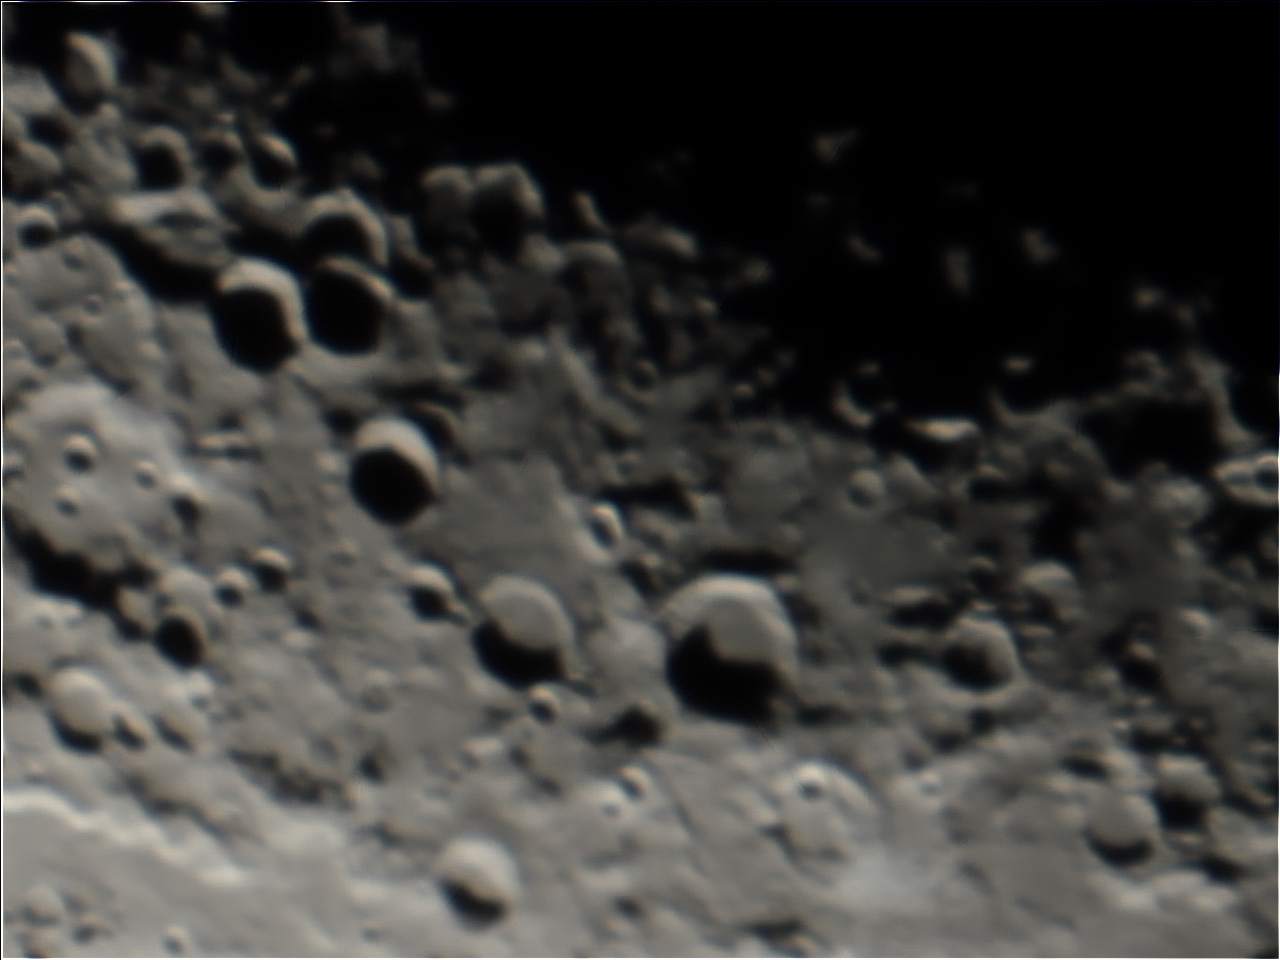
Even during strong atmospheric turbulence, reasonable detail can be retrieved, in Image 4, Lunar craters as small as about 5 Km can be seen, not as good as in Image 3 but still impressive.

Image 4. The stacked image from the movie shown in Image 2. Despite the strong atmospheric disturbance, fine detail can still be resolved. The crater to the far left is Sacrobosco. Author’s own work.

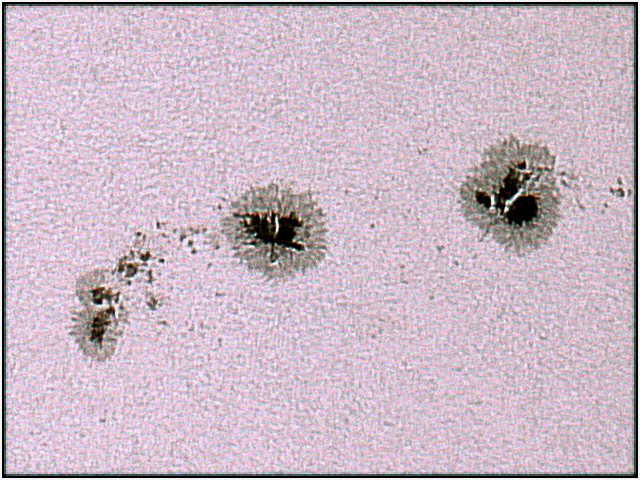
Of course webcam astronomy is not limited to the Moon. With the correct light rejecting filters, you can turn this powerful technique onto the Sun. During July 2016 there was a fantastic chain of Sunspots (see Image 5), these features change shape every day: merging, splitting and distorting providing a very dynamic and unique astronomical sight.
Of course before undertaking solar photography a few considerations must be addressed. (1) Make sure you research how to observe/image the Sun safely, I will not be happy if you go out and blind yourself after reading this article. (2) Be aware that the Sun will heat up your telescope creating turbulent air inside the tube, to avoid this problem I covered my scope in kitchen foil.

Image 5. A stacked image of sunspots taken on 19/07/2016. The internal structure of the Sunspots can be seen as well as individual granulations across the solar surface. Author’s own work.

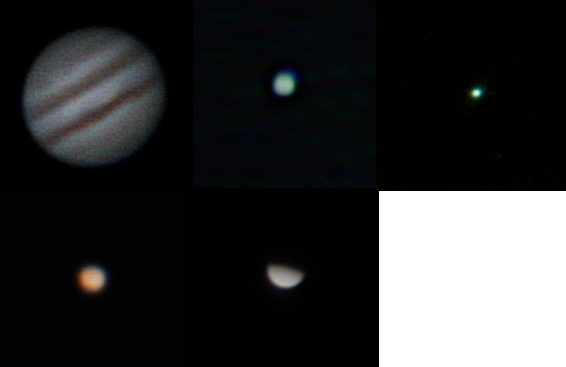
The planets are probably the most popular and evocative telescopic targets of all. Thankfully webcam imaging provides an easy way to image them and make your own Solar system collections! I’ve added my own incomplete collection in Figure 6. The sizes the planets appear are to scale.

Image 6. My Solar System collection: Jupiter (top left), Uranus (top middle), Neptune (top right), Mars (bottom left) and Venus (bottom middle). Author’s own work.

For the planets, I used exactly the same method as with the Moon. The hardest part is finding the planets in the night sky. If you are unfamiliar with night sky then their locations can be found using planetarium software like Stellarium. I must also mention that you will need some experience finding Uranus and Neptune, they are faint and you will need to be able to use a finder scope to home in on these planets.

In conclusion, I started learning astrophotography in the wrong order, webcam astronomy provides all the excitement of capturing a new world in your back garden but without the long nights, tiresome setup and ruinously expensive equipment.  So fetch that old scope out of your garage, buy a webcam and get recording I have evidence to show you wont be disappointed.

Post by: Daniel Elijah.

Top ten Astronomy fails

In this post I have decided to inject a bit of comedy and concentrate on some of the funny and embarrassing things that have happened to me or to others whilst trying (and sometimes failing) to do astronomy. I must begin with a confession: many of the methods I use to observe the stars have been learned through mistakes and failure some of which are infuriating and others hilarious. So, without further delay here are my ten most embarrassing, costly and idiotic astronomy fails.

1. Right place right time, wrong year.
About a year ago I was setting up my scope, which is electronically controlled. In order to work properly, it must know your precise location, time and the position of at least one star in the sky. After inputting this data, I began locating my first target but there was a problem, the telescope moved below the horizon. However, I knew from my sky map that the target was about 10 degrees above the horizon. I spent about 2 hours re-aligning my scope with known stars but still the problem persisted. Eventually, I decided to start setting the telescope up from scratch when I noticed the date I inputted was wrong…very wrong! The year was 2015 but I typed in 20015, an error of 18000 years. Over this period of time, stars move substantially around the sky, familiar constellations will morph into new shapes and the polar axis of the Earth’s spin will also change. To be honest, I was shocked the telescope had data on star locations this far in the future!

2. A long trip for nothing.
This mistake is also mine. I planned a long trip into the peak district to do some dark sky astronomy. After a 90-minute drive I realised I forgot my telescope’s counterweight bar. Without that single steel bar, no astronomy could happen. I arrived home later that night and didn’t speak of my error for the next two days.

3. The ultimate light pollution blocker.
Many years ago when I was just starting my hobby I wanted to show some of my family and friends what great things could be seen through the telescope eyepiece. There was an ulterior motive of course, I wanted to make sure Christmas presents would benefit my astronomy hobby not my sock draw. I had lined the finder scope on the Orion nebula and started searching for it in the main scope. I noticed the sky was particularly black and I started explaining how my light pollution filter (a recent purchase) was great at removing the orange skyglow from the streetlights. A few minutes later and in front of everyone, my friend gleefully removed the lens cap from the end of the telescope explaining how this was the ultimate light pollution filter, unfortunately it also filters out all other forms of light!

4. The Walnut filter.
Earlier this year a stargazer was observing Venus low in the southwest. After a short time he noticed that the planet started showing very interesting distortions which he attributed to freak atmospheric effects. Most astronomers are familiar with the shimmering effect the atmosphere has when observing planets, but this was different. Unfortunately before he could conclude a new scientific observation, he took his eye away from the eyepiece and noticed that Venus had moved behind a nearby Walnut tree. The light was passing between its branches and diffracting, causing the strange effect.

5. That’s not Jupiter!
I usually find that people are quite excited to discover something new about the night sky, so perhaps this next story is just the exception which proves this rule. A few years ago, I was walking home with my girlfriend when I pointed to a bright point of light in the sky and said ‘Look there’s Jupiter’.  A woman passing by interjected saying, ‘no it’s not!’ I was quite shocked and politely said that I had already seen it in binoculars and in a telescope so I was quite sure. To which she replied that it was just a bright star and that if it were Jupiter you would see its disk and the great red spot. I didn’t have a pair of binoculars on me so I suggested she take a look using binoculars when she gets home. I wanted to mention that because Jupiter is very distant from us it appears as a bright star, but you can see its disk even with a cheap pair of binoculars. Unfortunately, she was not open to furthering our discussion so we left it there. I went home thinking that before I knew where the planets were or what they looked like in the sky I assumed that they were too faint to see. She assumed they would be so obvious that they would not need to be pointed out in the sky. I am not counting her misconception about Jupiter as the astronomy fail but here unwillingness to consider what other people are saying certainly deserves a place on this list!

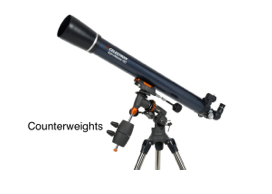
For a German Equatorial mounted telescope like the one above, the counterweights allow the telescope to move easily around its polar axis. If you remove them, bad things will happen.

6. Don’t forget the counterweights.
An astronomer had set up his scope (a large and heavy 10 inch diameter Schmidt-Cassegrain) and began to align his kit. This involved kneeling down under the scope and adjusting the angle of the mount so that it pointed towards the Earth’s north celestial pole. Sadly for him, he forgot to attach the counterweights to the mount and consequently, the telescope swung round and crashed into his head, smashing his glasses, breaking the camera attached to the telescope and probably leaving him seeing stars. This is quite a graphic reminder to always put counterweights on your mount before the telescope to avoid this type of accident.

7. A burning passion for solar observing.
I’m not sure when or where this happened but this story is certainly part of astronomy folk law. An astronomer was safely observing the Sun with a properly attached Solar filter over the front of the telescope – solar observing without the correct kit could result in instant and permanent blindness. However, despite being safety conscious, after a short time he noticed a painful sensation on his head. Unfortunately he had left the finder scope without any lens caps and it acted like a magnifying glass – burning a small painful spot onto his scalp.

8. Temperature difficulties
In order to get the best performance out of a telescope, you must first allow it to cool down to ambient temperature. This reduces turbulent air around the telescope and produces a clearer image. Unfortunately, as a telescope cools down other issues can arise. An astronomer was waiting for his equipment to cool down when the metal screw that holds the telescope onto its mount contracted just enough to release the telescope tube. The resulting crash smashed both the telescope and the £2000 camera attached to it. Take home message, always check your connections after cooling your scope!

9. Hubble space telescope error
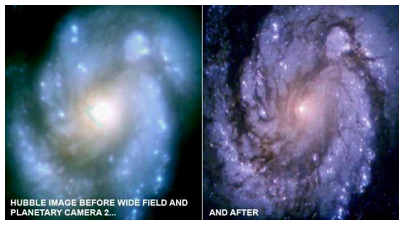
This is the most expensive mistake on the list, you may even be aware of it. Nowadays, we take the ground-breaking image quality of the Hubble Space Telescope (HST) for granted. When it was launched in 1991, engineers found that its main mirror was very slightly flatter near its edge (an error of 2.2um or 0.0022mm). This meant that it could not focus light precisely at one point, reducing the overall image quality and leaving a $4 billion telescope almost useless. The cause of the problem was mainly down to NASA relying on test data from only one instrument. To solve the problem NASA replaced the camera with a new version containing a corrective lens that compensated for the incorrect mirror. The cost of which involved commissioning new imaging equipment, an extra shuttle launch and losing the opportunity to use the HST for high-contrast imaging for two years.

HST’s misshaped mirror was only corrected two years after launch with a new, specially designed camera.

10. Great expectations.
This one is an error many newcomers to the hobby make, partly because of some pretty dodgy marketing – see the unobtainable views pictured on the very basic telescope above. Put simply, it is the expectation that a small telescope operated by someone with little experience will produce celestial views equaling the HST. If you search for a beginner telescope online and run through its reviews there will be a number complaining of blurry images, poor zoom and undefined galaxies. These limitations are sadly just unavoidable consequences of living under a turbulent atmosphere or owning a telescope that doesn’t have the HST’s 2.4m diameter aperture. In the end, I class this as one of the most damaging errors here because for those who make it astronomy becomes a frustration rather than a fascination. However, once you get familiar with the capabilities of your telescope/binoculars you quickly start to appreciate the significance of those faint smudges of light!

So there we are, conclusive evidence that astronomy doesn’t always go to plan even when the weather behaves itself. If you have any other interesting stories please put them in the comments. Have a great Christmas and don’t knock yourself out with a non-counterweighted telescope!

Post by: Daniel Elijah
Save

Save

Light pollution – are we losing the night sky or is there still hope?

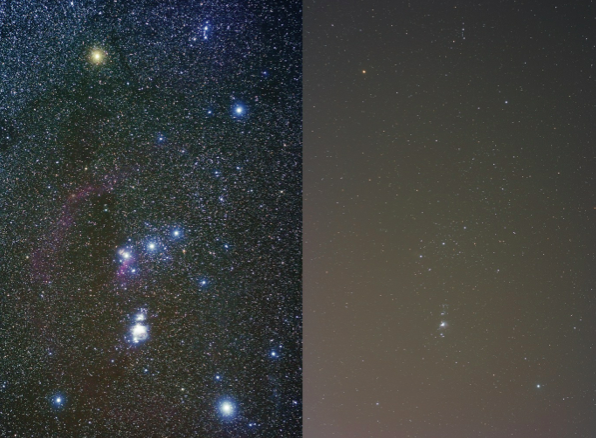
I guess it was inevitable that I would eventually write a post about light pollution – the modern day scourge which reduces the visibility of celestial objects and forces astronomers to travel hundreds or sometimes thousands of miles in order to avoid it. There’s even a saying that an astronomers most useful piece of equipment is a car! Probably the most damaging effect of light pollution is not that it makes faint galaxies and nebulae difficult to spot and photograph (there are ways of overcoming this), but that whole generations of children grow up not knowing what a truly dark sky looks like!

Figure 1. The effect of light pollution on the night sky. This split image shows how artificial light washes out most of the faint detail in the constellation Orion.


I am one of those children. I grew up in suburban England (about 60 miles north west of London) where the night sky had a beige/orange tinge, the constellations were difficult to spot and the Milky Way was something you either looked up in a book or ate. I was about 14 when first I saw a proper night sky; on holiday in North West Scotland. I was so fascinated with the sight that an interest in astronomy embedded itself in me and never left! I was lucky, I was still quite young and my interest could be nurtured before the realities of life (exams, chores, jobs…) stepped in. Many aren’t so lucky. I always wonder, how many inquisitive people never experience the joy of observing the universe because of that orange glowing veil of light pollution (LP). It is the barrier that light pollution creates that prompted me to write this post.

I will now concentrate on the issues LP poses to astronomy. Before I do so, I should say that good evidence exists showing that LP can negatively affect human health (such as disrupting sleep cycles) and the natural environment (changing bird migration patterns etc), detailed discussions can be found here. Regarding astronomy, light pollution is

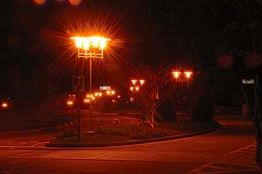
Figure 2. Direct light pollution. These street lights in Atlanta radiate light across a wide area, stargazing near these will be very difficult. Image taken from http://www.darkskiesawareness.org

problematic for two main reasons. (1) Unwanted light can travel directly into your eyes ruining the dark adaption they need to observe faint celestial objects. It can also invade telescopes causing washed out images and unwanted glare. This form of light pollution involves light traveling directly from an unwanted light source (such as a street lamp) to your eye/telescope.

The second source of LP comes from the combined effect of thousands of artificial lights, known as sky glow. Sky glow is form of LP most people are familiar with; the orange tinge that

Figure 3. Skyglow in Manchester. This light is scattering off the atmosphere and falling back to the ground. As a result, the sky looks bright orange. Image taken from https://commons.wikimedia.org/

in some places can be bright enough to read by! Sky glow exists because the Earth’s atmosphere is not completely transparent, it contains dust, water droplets and other contaminants that scatter man made light moving through it. Some of this light is scattered back down towards the Earth, it is this scattered light that drowns out the distant stars and galaxies. It is a visual reflection of the amount of wasted light energy we throw up into the sky.

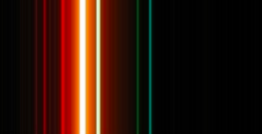
You may be thinking that LP spells the end for astronomy in urban areas. Well luckily there are ways around the problem. One way is to  filter it out. The good thing about skyglow is that it is produced mainly by street lamps that use low pressure sodium bulbs. The light from these bulbs  is almost exclusively  orange with 589nm wavelength. Figure 4 shows a spectrum of the light given out by one of the lamps.

Figure 4 - Different colours of light produced by a typical low pressure Sodium street light. The vast majority of the light is orange (589nm) as shown by the bright orange bar. Image taken from: https://commons.wikimedia.org/
Figure 4 – Different colours of light produced by a typical low pressure Sodium street light. The vast majority of the light is orange (589nm) as shown by the bright orange bar. Image taken from: https://commons.wikimedia.org/

Since this light is comprised of essentially one colour, we can use a simple filter to cut out this wavelength whilst leaving other wavelengths unaffected. In addition, the wavelength of the sodium lights is quite different from the colours produced by many nebulae. Therefore when we filter out the orange light, we don’t also block the light coming from astronomical objects.

So…what am I worrying about then? If light pollution can be overcome by filtering out certain wavelengths of light then astronomy should be possible from anywhere. Well, not quite. Filters are not perfect, even the best filters will block other colours and dim our view of the stars. There is also another reason to worry – street lights are changing. As you may

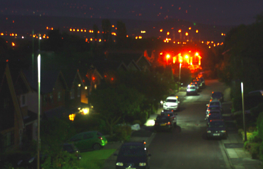
Figure 5 - LED and sodium streetlights outside my house. LEDs produce light that is harder to block using conventional filters, Sodium lights (seen here as orange) shine lots of light into the sky contributing to sky glow. (Image is my own)
Figure 5 – LED and sodium streetlights outside my house. LEDs produce light that is harder to block using conventional filters, Sodium lights (seen here as orange) shine lots of light into the sky contributing to sky glow. (Image is my own)

already know, street lights are being altered from the sodium bulbs to LEDs. These LEDs are more energy efficient and produce a more natural white light. However, this white light is harder for astronomers to filter out without also blocking light coming from deep space. Luckily, these newer lights are better at directing their glow downwards towards the ground rather than allowing it to leak up into the sky. Figure 5 shows the LED and Sodium lights outside my house. The LED lights appear darker because most of their light is directed towards the ground.

There is still debate in the astronomy community about whether the new street lighting will be beneficial for astronomy. At the moment, LEDs are being introduced slowly so it is difficult to make a clear comparison. My hunch is that when Sodium lights are replaced completely, there will be an improvement in our night skies and finally young people will grow up seeing more of the night sky.

Post by: Daniel Elijah
 

Save

How to perfect your astro-photos.

In my last post I discussed why astronomers take multiple identical photographs of the same astronomical object in order to reduce the effects of random noise. I discussed how this noise arises and gave examples of the improvements gained by stacking multiple photos together. Of course, reducing random noise within your image is an important first step but, if you really want to obtain the perfect astro image, there is still more to consider. Both your camera and telescope can introduce a number of inconsistencies in your images, these occur to the same extent in every photograph you take, meaning they cannot be cancelled out like random noise can. Here I will discuss what these inconsistencies are and the ways astrophotographers remove them.

So…what are these inconsistencies? Well they come in three types and each must be dealt with separately:

The first of these is a thermal signal which is introduced by the camera. This tends to look like an orange or purple glow around the edge of an image. It develops when heat from the camera excites electrons within the sensor. As we take a photo, these heat-excited electrons behave as though they have been excited by light and produce false sensor readings. This effect gets stronger with increasing exposure time and temperature. The best way to remove this is to take an equal length exposure at the same temperature as your original astro image but with no light entering the telescope/camera (perhaps with the lens cap on). The resulting picture will contain only the erroneous thermal glow. This ‘dark’ frame can then be subtracted from the original image.

fig_1
Figure 1. The original exposure (showing the constellation Orion at the bottom) shows a strong thermal signal in the top left. By taking a dark frame of equal exposure, we can subtract out the thermal signal, giving a better result.

The next inconsistency is known as bias. This constitutes the camera sensor’s propensity to report positive values even when it has not been exposed to light. This means that the lowest pixel value in your picture will not be zero. To correct this, it’s necessary to shoot a frame using the shortest exposure and the lowest ISO (sensitivity) possible with your kit then subtract it from the original frame. For most modern DSLR cameras, this subtraction has a very small effect but it does increase the contrast for the faint details in the picture – which is particularly important when shooting in low light.

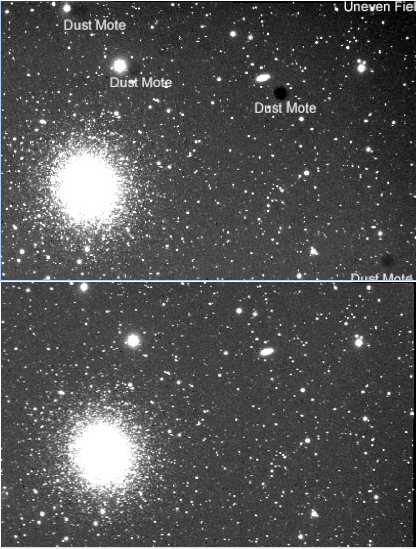
Finally, and arguably the most important image inconsistency of all – uneven field illumination. This problem occurs when the optics within a telescope do not evenly project an image across the camera’s sensor. Most telescopes (and camera lenses) suffer from this problem. A common cause of uneven illumination is dirt and dust on the lens or sensor, which can reduce the light transmitted to parts of the sensor.

This is the objective lens from my telescope before and after cleaning. Although small specs of dust do not seriously affect the overall quality of the image, they can contribute to uneven brightness in the image.

The final cause of uneven illumination is vignetting, this is a dimming of the image around its edges. Vignetting is normally caused by the telescope’s internal components such as the focus tube and baffles (baffles stop non-focused light entering the camera). These parts of the telescope can restrict the fringes of the converging light from entering the camera. So how do we combat this…keep cleaning the lens? Rebuild the internal parts of the telescope?…no. The answer is simple; take a ‘flat’ calibration frame. All you need to do is take an image of a evenly illuminated object (such as a cloudy sky, white paper, or blank monitor screen). Since you know the original scene is uniformly bright, any unevenness in the brightness of this image must be due to issues with the telescope. You then divide the brightness of the pixels in the original image by the pixels in the flat frame and magically, the unevenness is gone.

For your enjoyment, here’s some examples of flat frames taken from across the Internet, the middle image is from my scope. There are some diabolical flats here; I wonder if it’s even possible to conduct useful astronomy with such severe obstructions in a telescope!

Some examples of flat field frames taken by different telescopes. All these frames show were light is being blocked from reaching the camera sensor. My telescope’s flat frame is the middle picture; it looks good in comparison.
By applying the flat frame correction, the background of the image becomes more even, and dark patches due to dust disappear! No need to clean your scope! (Image taken from http://interstellarstargazer.com).

For many people starting to turn their cameras and scopes to the heavens, all of this does sound rather arduous but there is software out there that will automatically combine your star images with the three calibration images and spit out what you want (see Deep Sky Stacker). I was amazed that for reasonably little effort and no extra money, I could improve the quality of my images significantly.

Post by: Daniel Elijah
 

Why do astrophotographers spend all night under the stars?

It’s a sensible question. You may think that our love of the celestial domain keeps astrophotographers up all night, or maybe it’s because there are so many astronomical targets out there that it takes all night to photograph them. Or maybe because our telescopes are so complicated and delicate it takes us hours to set them up. Well these points may partly explain why I frequently keep my wife awake as I struggle to move my telescope back into the house…often past 4:00am! But there is a deeper reason; one that means almost every astronomical photo you see probably took hours or days of photography to produce. In this post I shall explain, with examples, why I and other poor souls go through this hassle.

Let me begin by saying that during a single night (comprising maybe 4-6 hours of photography time), I certainly do not spend my time sweeping across the night sky snapping hundreds of objects. Instead, I usually concentrate on photographing  1 or 2 astronomical targets – taking more than 40 identical shots of each. In this regard, astrophotography is quite different from other forms of photography. But why do this, what is the benefit of taking so many identical shots? Well, unlike most subjects in front of a camera, astronomical targets are dim…very dim. Many are so dim they are invisible in the camera’s viewfinder. To collect the light from these objects (galaxies, nebulae, star clusters…etc.) you must expose the camera sensor for several minutes per photo, instead of fractions of a second as you would for daytime photography. Unfortunately, when you do this, the resulting image does not look very spectacular – it’s badly contaminated with noise.

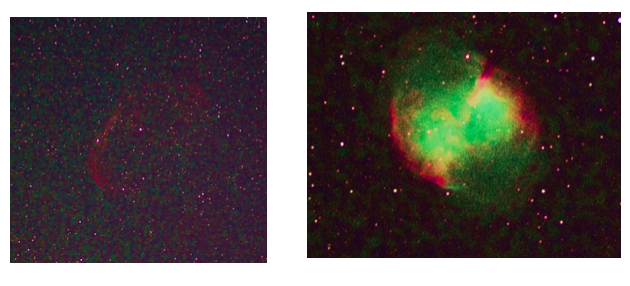
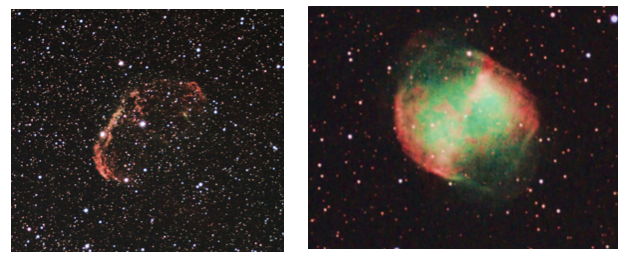
Two images taken as 3-minute single exposures, noise is prevalent in both. Details such as the edges of the nebulae and faint stars cannot be seen. D Elijah.

These are 3-minute exposures of the Crescent and Dumbbell nebula in the constellations Cygnus and Vulpecula respectively. You can see the nebulae but there is also plenty of noise obscuring faint detail. This noise comes from different sources. The most prevalent being the random way photons strike the camera’s sensor – rather like catching rain drops in a cupped hand, you cannot be sure exactly how many photons or rain drops will be caught at any one time. A second source of noise comes from the fact that a camera does not perfectly read values from its sensor; some pixels will be brighter or dimmer as a result. Finally, a sensor’s pixels measure light within a limited range of values. If the actual value of light intensity for a given pixel is between two of these values then there will be an error in the reading. There are further types of noise in astronomical images such as skyglow, light pollution and thermal noise but these can be dealt with by calibrating the images – a rather complex process I will discuss in a future post!

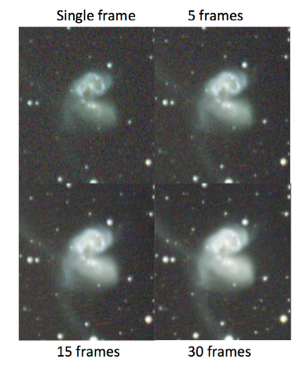
By stacking multiple images, noise is reduced and the signal, like faint stars and subtle regions of nebulae, become more apparent. Photo sourced from www.dslr-astrophotography.com.

The best way of dealing with this noise is to take many repeated exposures and combine (stack) them. This method takes advantage of the fact that each photo will differ because of the random noise they contain but critically they will all contain some amount of signal (the detail of the target you photographed). As you combine them, the signal (which is conserved across the pictures) builds in strength, while the noise tends to cancel itself out. The result is an image with more signal and relatively less noise giving more detail than you could ever see in a single photograph. To the left is a good example of the improvement in quality you might expect to see as you stack more photos or frames.

In addition, the bit depth of the image, which is the precision that an image can define a colour, also increases as you stack. For example, it you have a single 3-bit pixel (it can show 2³=8 values, i.e. from 0 to 7) a single image may measure the brightness of a star as 5, but the true value is actually 5.42. In this scenario, taking 10 photos, each giving the star a slightly different brightness value, may give you 5, 5, 6, 5, 7, 6, 4, 5, 5 and 6, the average of these being 5.4 – a more accurate value than the original, single shot, reading. The end result is a photo with lots of subtle detail that fades smoothly into the blackness of space.

So here are my final images of the Crescent and Dumbbell nebulae after I stacked over 40 frames each taking 3 minutes to capture (giving a total exposure of 2 hours each).

Screen Shot 2016-07-29 at 18.08.18

Was it worth being bitten to death by midges, setting my dog off barking at 4am, putting my wife in a bad mood for the whole next day…I think yes!

Post by: Daniel Elijah
Save